| Valley | High Security | General Security | Supplementary | Unregulated | Aquifer | Total |
|---|---|---|---|---|---|---|
| Murrumbidgee | – | 85,011.0 | – | – | – | 85,011.0 |
| Murray | 5,123.5 | 83,006.0 | 100,000.0 | 12,965.0 | – | 201,094.5 |
| Darling | 500.0 | 47,800.0 | 250,000.0 | – | – | 298,300.0 |
| Total | 5,623.5 | 215,817.0 | 350,000.0 | 12,965.0 | – | 584,405.5 |
| Valley | High Security | General Security | Supplementary | Unregulated | Aquifer | Total |
|---|---|---|---|---|---|---|
| Gwydir | 1,249.0 | 17,092.0 | 3,140.5 | – | – | 21,481.5 |
| Macquarie | – | 48,419.0 | 1,451.5 | 2,916.0 | – | 52,786.5 |
| Lachlan | 1,795.0 | 37,595.0 | – | – | – | 39,390.0 |
| Murrumbidgee | – | 31,424.0 | 6,700.0 | 9,948.0 | 1,857.0 | 49,929.0 |
| Lowbidgee | – | – | 148,087.0 | – | – | 148,087.0 |
| Murray | 2,027.0 | 30,157.0 | – | – | – | 32,184.0 |
| Barwon-Darling | – | – | – | 5,542.0 | – | 5,542.0 |
| Total | 5,071.0 | 164,687.0 | 159,379.0 | 18,406.0 | 1,857.0 | 349,400.0 |
Notes
- These figures have been rounded up. They are accurate at the time of publication.
- The tables are operational records, so some minor adjustments may need to be incorporated when the data is verified by audit.
- The Living Murray licences are listed separately as they are held under a joint venture arrangement with parties to the Murray Darling Basin Agreement.
The NSW Government purchased water for the environment at market rates through existing water markets.
Previous use of water for the environment
The graph below identifies the total use of water for the environment in New South Wales over time.
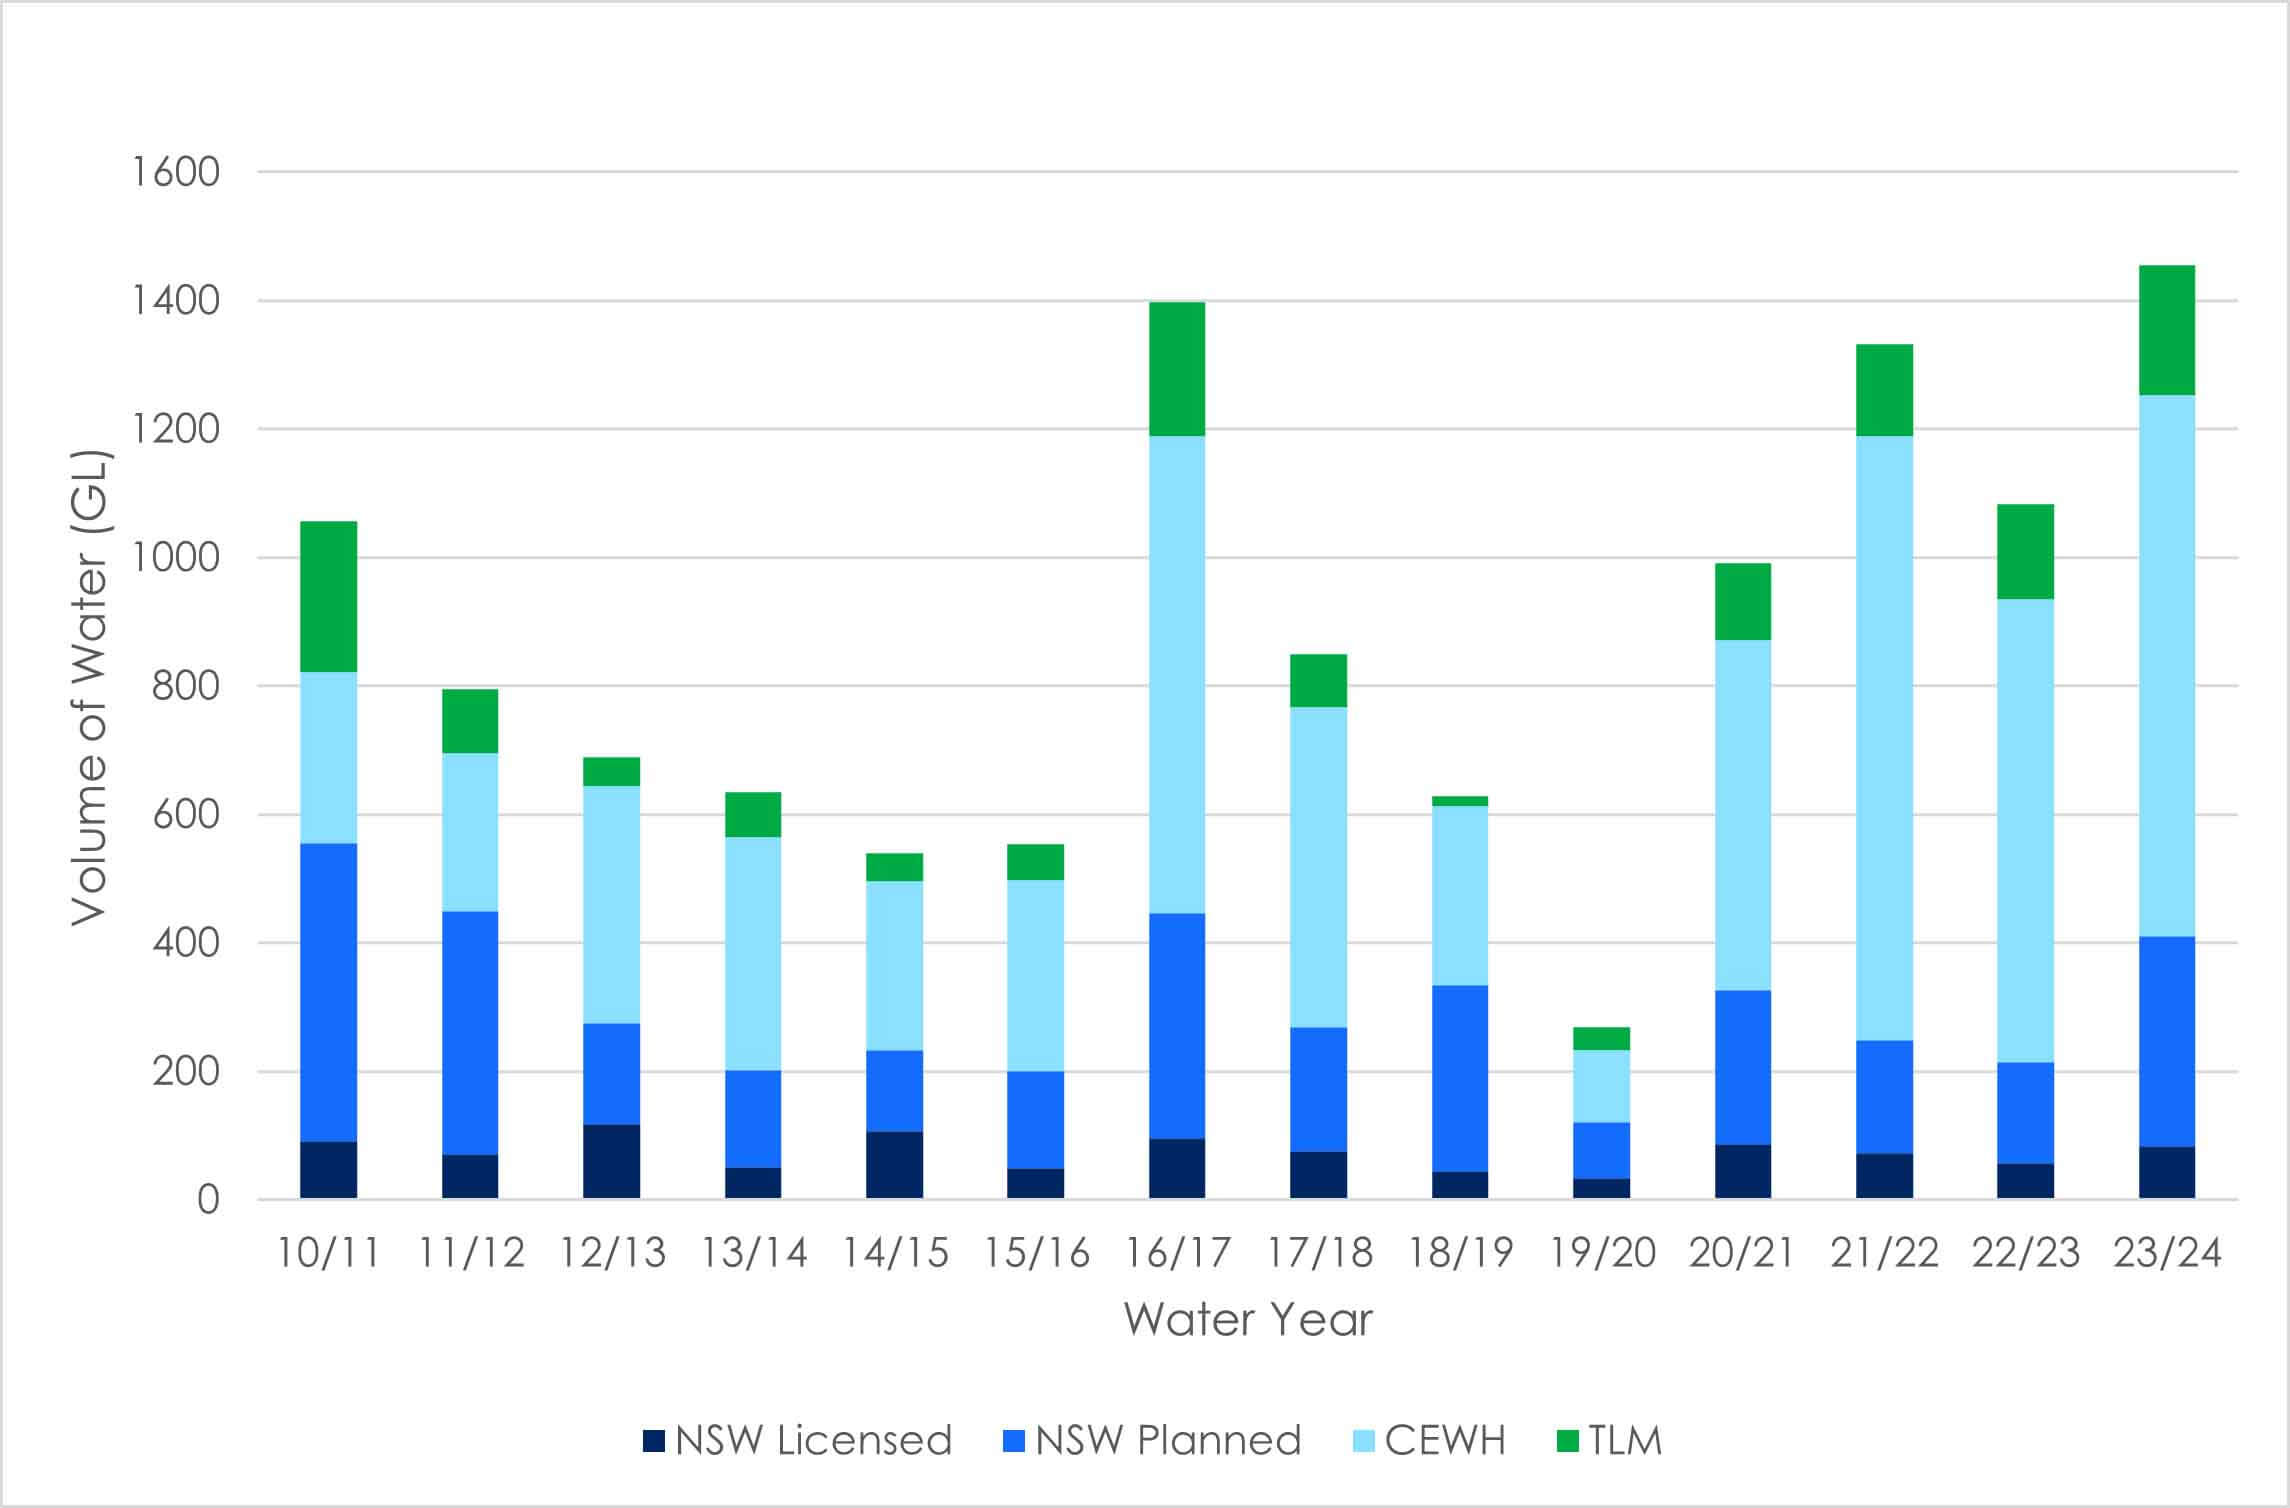
Annual volumes of water delivered to NSW targets from the Living Murray Program licences purchased by the NSW Government, including planned water (NSW) and licences purchased by Commonwealth Government (CEWH)