Energy, Environment and Science (EES) maintain 20 air quality monitoring stations in the Hunter Valley: 3 NSW Government-funded stations in the Lower Hunter, 3 industry-funded stations in the Port of Newcastle and 14 industry-funded stations in the Upper Hunter.
The industry-funded Upper Hunter and Newcastle Local air quality monitoring networks were established in 2011 and 2014, respectively, specifically to monitor local industrial and other pollution sources in the region. Due to the proximity of industrial sources, the national standards do not apply directly to the data collected at these monitoring stations. However, EES recognises that there is a desire within the community to know how air pollution levels at these stations compare against the standards. Therefore, EES uses national benchmarks (i.e. ambient air quality standards) in this section to evaluate air quality levels throughout the Hunter Valley.
More information on these networks can be found on the EES website, including seasonal newsletters published on a regular basis.
Large population centres
Gaseous pollutants
Sulfur dioxide and nitrogen dioxide met the relevant hourly, daily and annual national standards in the Lower and Upper Hunter regions during 2019.
In the Lower Hunter, there were 5 days over the ozone national standards (5, 10, 19, 21 and 29 December). Beresfield recorded 4 days, Newcastle recorded 2 days and Wallsend recorded 4 days. In comparison, there was 1 day over the ozone standards at Beresfield in 2018.
Particles (PM10)
Within the Hunter Valley, PM10 levels are generally highest at Stockton in the Newcastle Port area, due to the influence of sea salt under onshore winds (Lower Hunter Particle Characterisation Study) (refer to the Stockton tab for more information). In the Upper Hunter region, PM10 levels are generally highest at sites closest to mining activity.
Annual averages
In 2019, annual average PM10 levels were above the benchmark at 8 of the 9 Hunter large population centre stations. PM10 annual average levels remained below the benchmark at Wallsend. Annual averages ranged from 22.9 µg/m3 at Wallsend to 43.6 µg/m3 at Stockton.
Daily averages
Daily average PM10 levels were above the benchmark on 71 days at one or more Hunter large population centres (excluding Stockton). These occurred on:
- 2, 5, 16–17 and 26 January
- 10–11, 13 and 19 February
- 6 and 31 March
- 2 May
- 8–9, 19 and 23 August
- 6 and 16 September
- 7, 17 and 24–31 October
- 1–3, 7–8, 11–12, 15–23 and 26–30 November
- 1–12, 14–16, 19–22 and 29–31 December 2019.
At Stockton, the daily PM10 average was over the benchmark on 102 days, predominantly affected by sea salt under onshore air flows, bushfire smoke and long-range dust transport. Refer to the Stockton tab for more information.
The maximum daily PM10 averages recorded in the Hunter at large population centres occurred on 26 November 2019, due to a combination of bushfire smoke and widespread dust. The maximum PM10 levels in the Upper Hunter and Newcastle regions on this day respectively were 246.7 µg/m3 at Aberdeen and 169.5 µg/m3 at Stockton.
Fine particles (PM2.5)
Annual averages
Annual average PM2.5 levels were above the benchmark at all Hunter large population centres. Annual averages ranged from 10.4 µg/m3 at Wallsend to 13.0 µg/m3 at Stockton.
Daily averages
Daily average PM2.5 levels were above the benchmark on 45 days at one or more large population centres. These occurred on:
- 1–2 and 8 June
- 25–26 and 29–31 October
- 1–3, 11–13, 15, 17–19, 21–23, 25–26 and 28–30 November
- 2–12, 14–16, 19, 21, 28, 30–31 December.
During winter, the events occurred on:
- 1 June at Stockton, potentially due to local industrial sources.
- 2 June at Muswellbrook and 8 June at Muswellbrook and Singleton, most likely due to wood smoke.
From the end of October, the region was affected by smoke from extensive bushfires during the bushfire emergency period and dust storms.
The maximum daily PM2.5 average occurred on 5 December 2019 at Wallsend, in the Lower Hunter, due to bushfire smoke. On this day, PM2.5 levels in the Lower Hunter ranged from 92.1 to 108.3 µg/m3.
In the Upper Hunter, the maximum daily PM2.5 average of 80.0 µg/m3 occurred at Camberwell small community station on 21 November, due to bushfire smoke. On this day Muswellbrook and Singleton recorded PM2.5 daily averages of 77.4 and 69.3 µg/m3, respectively.
Upper Hunter air quality monitoring network
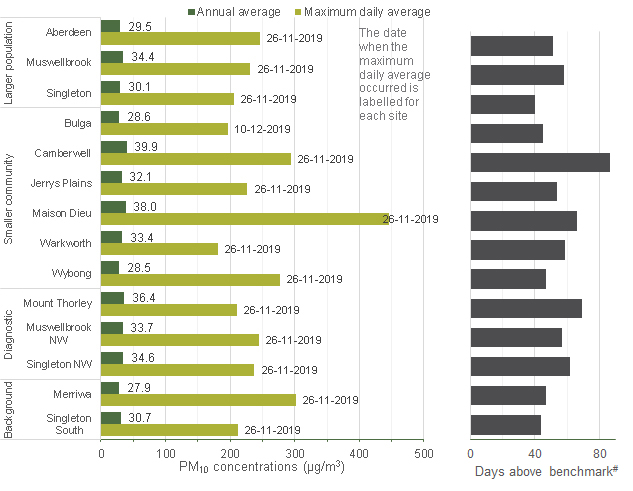
The Upper Hunter air quality monitoring network comprises 3 stations in larger population centres, 6 stations in smaller communities, 3 diagnostic stations close to mining operations and 2 background stations at the north-west and south-east extents of the region.
Annual averages
All monitoring stations in the Upper Hunter, including the Merriwa and Singleton South background stations, recorded annual average PM10 levels over the benchmark. PM10 annual averages in the Upper Hunter ranged from 27.9 µg/m3 at Merriwa to 39.9 µg/m3 at Camberwell.
The highest annual averages occurred at sites closer to mines, Camberwell (39.9 µg/m3), Maison Dieu (38.0 µg/m3) and Mount Thorley (36.4 µg/m3). This was followed by the Singleton North-west diagnostic site (34.6 µg/m3) and the Muswellbrook population centre (34.4 µg/m3).
The PM2.5 annual average at Camberwell was 10.5 µg/m3.
Daily averages
The Upper Hunter recorded 120 days when the daily PM10 levels were over the benchmark at one or more sites. Camberwell recorded the highest number of days over the PM10 daily benchmark in the region, with a total of 87 days.
Overall, there was a 64% increase in the number of days over the benchmark in 2019, compared with 2018 (73 days). The increase was due to the prolonged and consistent drought conditions experienced throughout New South Wales in 2019, along with smoke impacts from the extensive bushfires burning from late spring. This resulted in an increase in both particles transported into the region and particles from local industrial dust sources.
All sites in the Upper Hunter, except Bulga, recorded their highest daily PM10 average on 26 November. On this day, the region was affected by an extensive dust storm, bushfire smoke and local industrial dust sources under strong winds. The highest PM10 daily average on this day was 446.1 µg/m3, at Maison Dieu, with the highest hourly peaks occurring under strong north-northwest winds.
Camberwell recorded a maximum daily PM2.5 average of 80.0 µg/m3 on 21 November, due to bushfire smoke.
Annual and daily averages of PM2.5 levels in the Upper Hunter during 2019.
Note: # Days above the benchmark have not been divided into exceptional and non-exceptional events, as the NEPM goals do not apply to these sites.