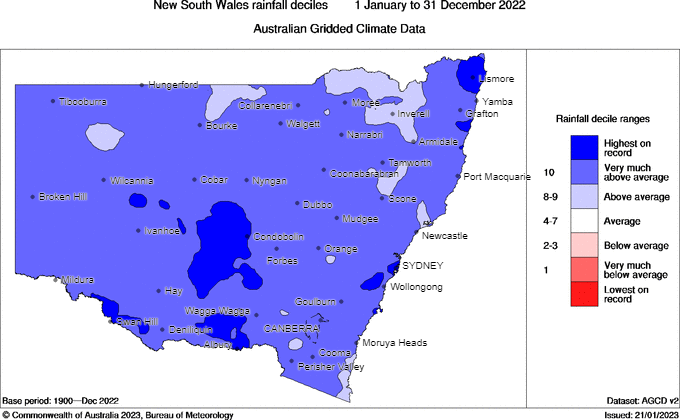
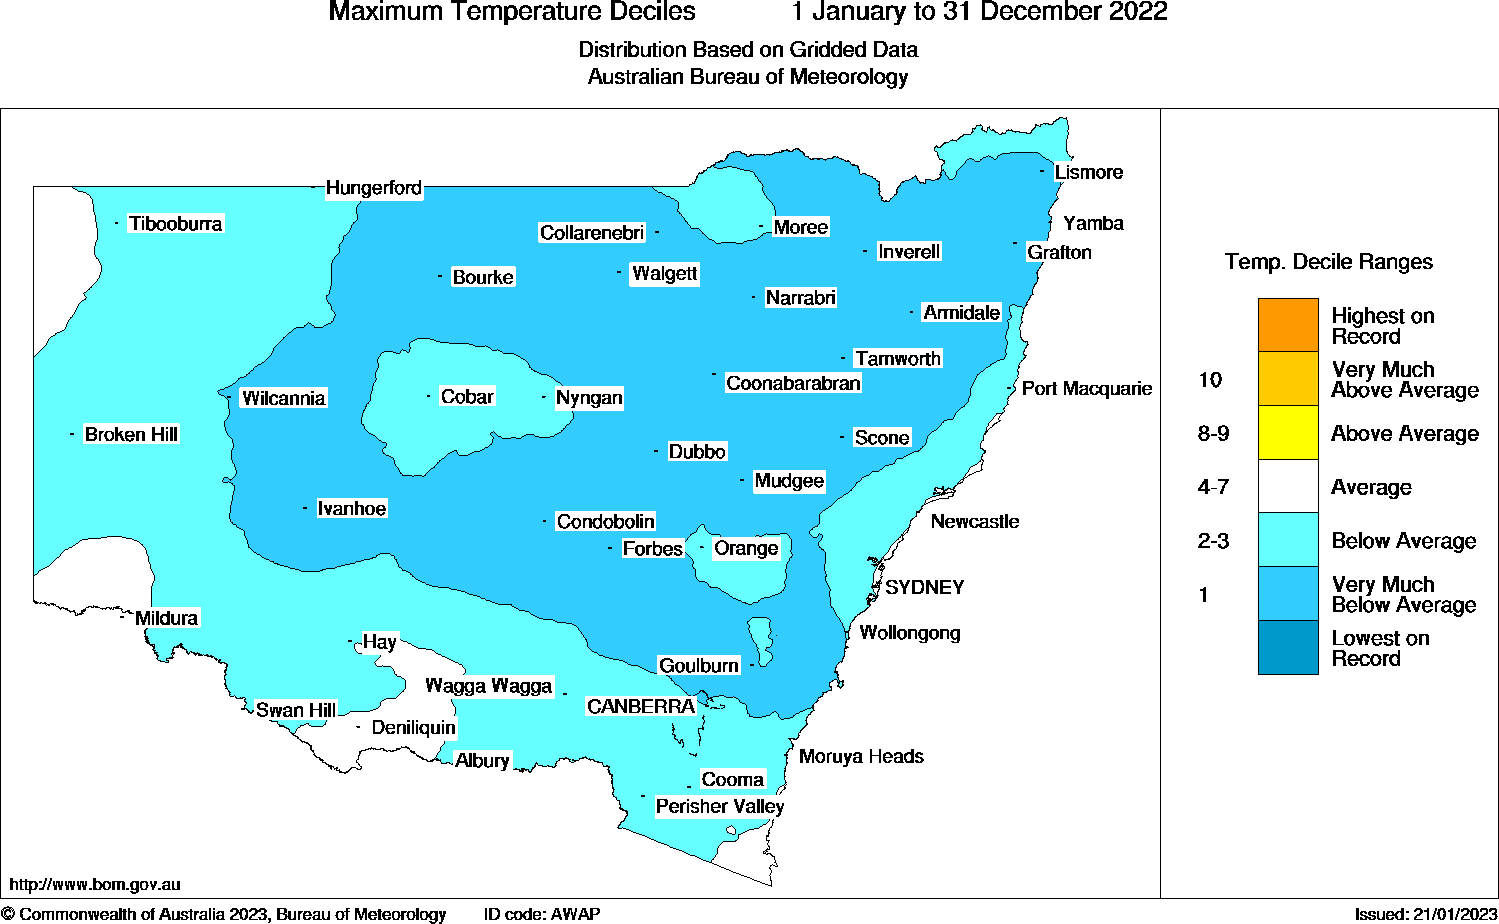
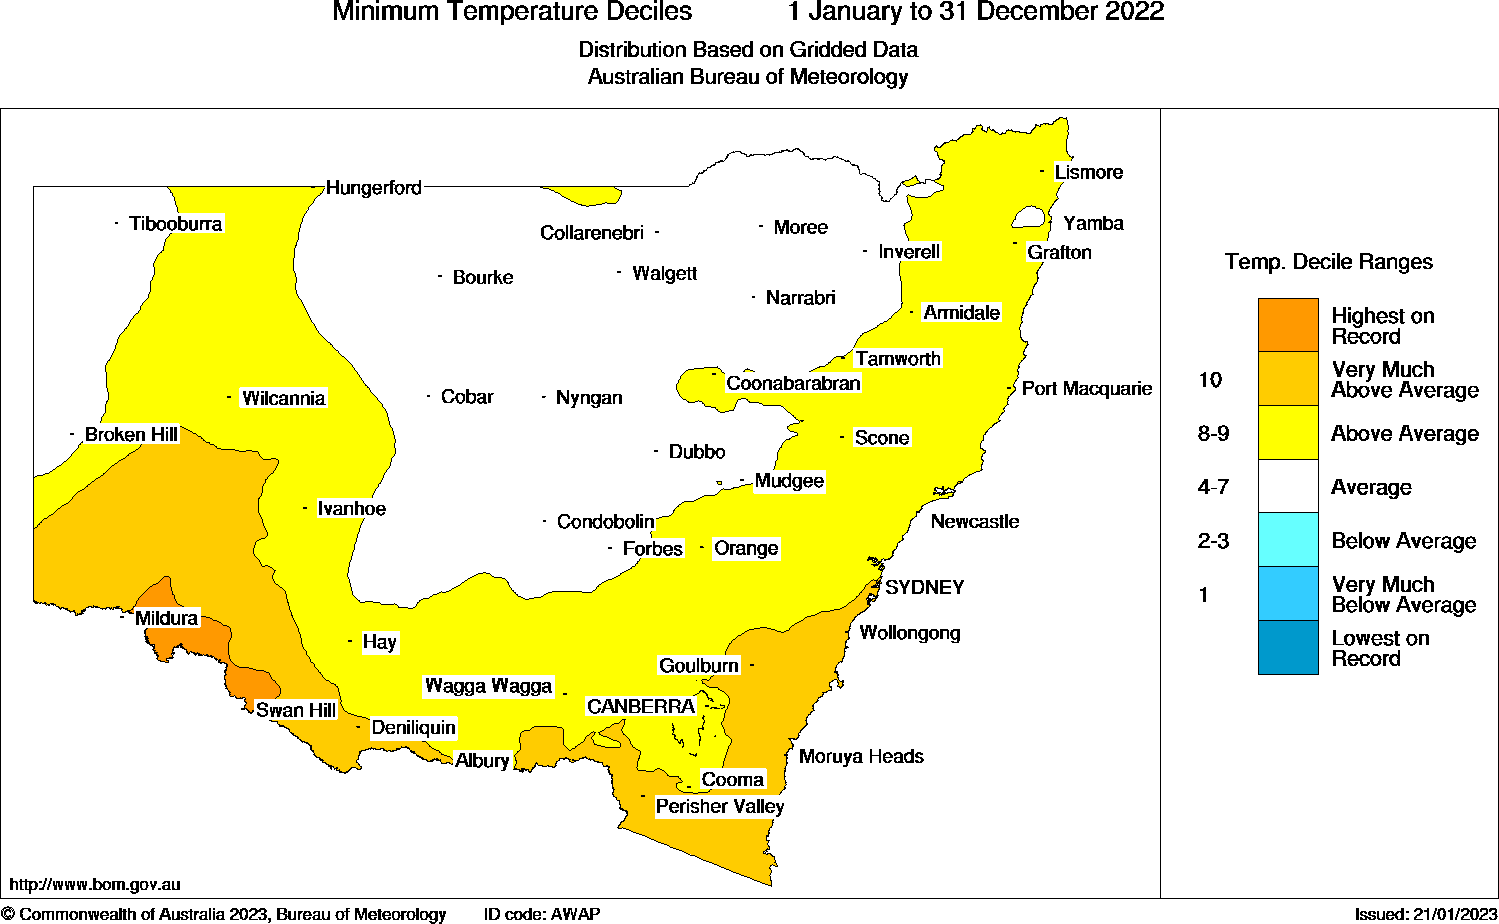
The Bureau of Meteorology reported that, in 2022, New South Wales experienced its second wettest year on record, with rainfall 55% above average for the state. Many sites recorded their highest annual rainfall totals on record. The state also experienced the coolest daytime temperatures since 1992, with maximum temperatures 0.48°C below the long-term climate average. Nights were warmer, with minimum temperatures 0.73°C above the long-term climate average.
The wet and cool daytime conditions in New South Wales in 2022 would have contributed to the improved air quality experienced across the state, by reducing the frequency and intensity of dust storms, bushfires and wind erosion events. Warmer than average winter minimum temperatures would have contributed to a reduction in smoky nights in regional areas from domestic wood heaters. There were also fewer hazard reduction burns in the year.
Climate summary
Summer 2021–22 was wetter than average for most of New South Wales. Rainfall was 30% higher than the climate average, with this summer being the wettest since 2011–12.
New South Wales overall recorded maximum temperatures 0.17°C above the climate average. Western New South Wales recorded average or above average maximum temperatures, whereas the coastal areas were cooler, recording average or below average temperatures.
Bureau of Meteorology New South Wales monthly climate summary: Summer 2022
Autumn 2022 was the wettest on record for parts of the NSW coast. Overall, New South Wales recorded rainfall 60% above the climate average, with this autumn being the seventh wettest since records began in 1900 and the wettest since 1990.
Cloudier conditions brought about cooler days and warmer nights in autumn. Maximum temperatures were generally average for New South Wales. Minimum temperatures were well above average for much of the state, reaching 1.66°C above the climate average, the fourth warmest since national records began in 1910.
Bureau of Meteorology New South Wales seasonal climate summary: Autumn 2022
Winter 2022 started with a very dry June, followed by a very wet July and August, resulting in major flooding along coastal New South Wales. Central parts of the NSW coast had the wettest July on record due to an east coast low during the first week.
Maximum temperatures were close to average through most of New South Wales, while the nights were warmer than average, with minimum temperatures 0.67°C above the climate average. Temperatures in June were colder than average, whereas temperatures in August were warmer than average.
Bureau of Meteorology New South Wales seasonal climate summary: Winter 2022
Spring 2022 was the wettest spring recorded since national records began in 1900, resulting in major flooding. Rainfall total was 136% higher than the climate average, breaking the previous spring record set in 2010. New South Wales experienced the wettest October on record and the fifth-highest monthly total for any month since 1900.
The average temperature for spring across the state was the coldest since 1992, recording 0.62°C below the climate average. Spring experienced maximum temperatures 1.73°C below average, the coldest since 1976 and the fifth coldest recorded since 1910. The minimum temperature for the overall state was 0.48°C above average.
Bureau of Meteorology New South Wales seasonal climate summary: Spring 2022
December 2022 was cooler than average in New South Wales and drier towards the north-east of the state. Rainfall for New South Wales overall was 42% below the climate average.
Maximum temperatures for the state were the coolest since 2011, with the temperature 1.68°C below the climate average. Minimum temperatures were also below average across the state.
Bureau of Meteorology New South Wales monthly climate summary: December 2022
NSW rainfall

Bureau of Meteorology map of New South Wales showing the rainfall decile ranges for 1 January to 31 December 2022 (lowest on record, very much below average, below average, average, above average, very much above average, highest on record).
Maximum temperature

Bureau of Meteorology map of New South Wales showing the maximum (daytime) temperature decile ranges for 1 January to 31 December 2022 (lowest on record, very much below average, below average, average, above average, very much above average, highest on record).
Minimum temperature

Bureau of Meteorology map of New South Wales showing the minimum (night-time) temperature decile ranges for 1 January to 31 December 2022 (lowest on record, very much below average, below average, average, above average, very much above average, highest on record).